Demo: IEEE-style SDR figures
This page is the visual entry point of the course. It shows automatically generated engineering figures that connect DSP models, FPGA implementation, RF behavior, receiver impairments, and measurement metrics.
The figures are generated by:
python tools/generate_ieee_plots.py
and updated by GitHub Actions.
Why this demo matters
The goal of the demo page is to show that the course is not only theoretical. Each figure answers a specific engineering question and is tied to a laboratory experiment.
| Lab | Figure | Engineering question | Key insight |
|---|---|---|---|
| Lab 1 | Tone FFT | Is the generated tone at the expected frequency? | FFT validates frequency accuracy and noise floor. |
| Lab 2 | AM vs FM | How does modulation type affect occupied bandwidth? | FM occupies wider bandwidth than AM for the selected parameters. |
| Lab 3 | QPSK constellation | How do noise and phase error affect IQ symbols? | IQ visualization exposes phase rotation and noise spread. |
| Lab 4 | Synchronization | How does CFO correction improve the constellation? | Synchronization converts a rotating cloud into stable symbol clusters. |
| Lab 5 | EVM | Which impairment degrades the signal most? | EVM provides a compact quantitative impairment measure. |
| Lab 6 | BER | How much does synchronization improve receiver quality? | BER links DSP corrections with final receiver performance. |
Hardware baseline
The demo is built around a practical SDR stand:
- Zynq-7020 + AD9363 board for RF generation and board-level experiments;
- RTL-SDR receiver for external observation;
- HDSDR for spectrum and waterfall inspection;
- MATLAB / Simulink / Python / GNU Radio / C++ for offline analysis.
The key idea is simple:
Model → FPGA/RF → external receiver → IQ recording → offline metrics
Engineering insights
FFT is a measurement, not just a picture
The Lab 1 figure demonstrates why frequency axis scaling, windowing, and normalization matter. A visible peak is useful, but a measured peak with parameters is engineering evidence.
Modulation changes occupied bandwidth
The Lab 2 figure shows that AM and FM can be immediately distinguished in the spectrum. This gives students an intuitive bridge between formulas and RF observation.
Constellation diagrams expose receiver quality
The Lab 3 and Lab 4 figures show that IQ plots reveal noise, phase error, CFO, and synchronization effects more directly than time-domain plots.
Metrics close the engineering loop
EVM and BER connect visual signal quality with quantitative receiver performance. This is the transition from observation to validation.
Lab 1 — Tone FFT
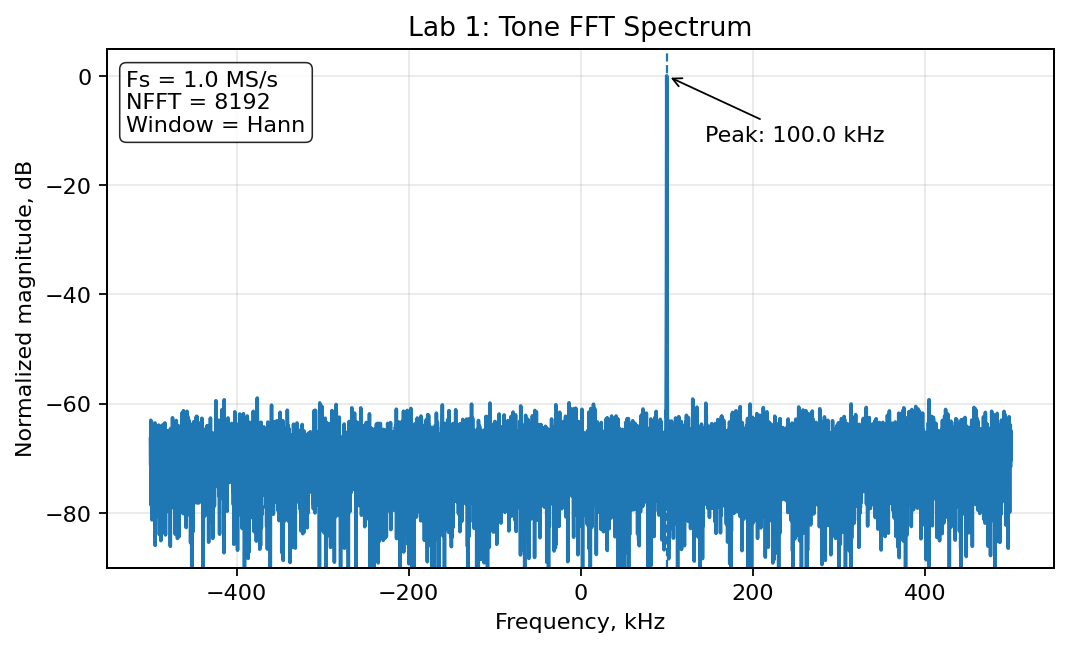
Interpretation: the tone should appear as a narrow spectral peak at the expected frequency offset. The parameter box documents the sampling rate, FFT size, and window.
Lab 2 — AM vs FM Spectrum
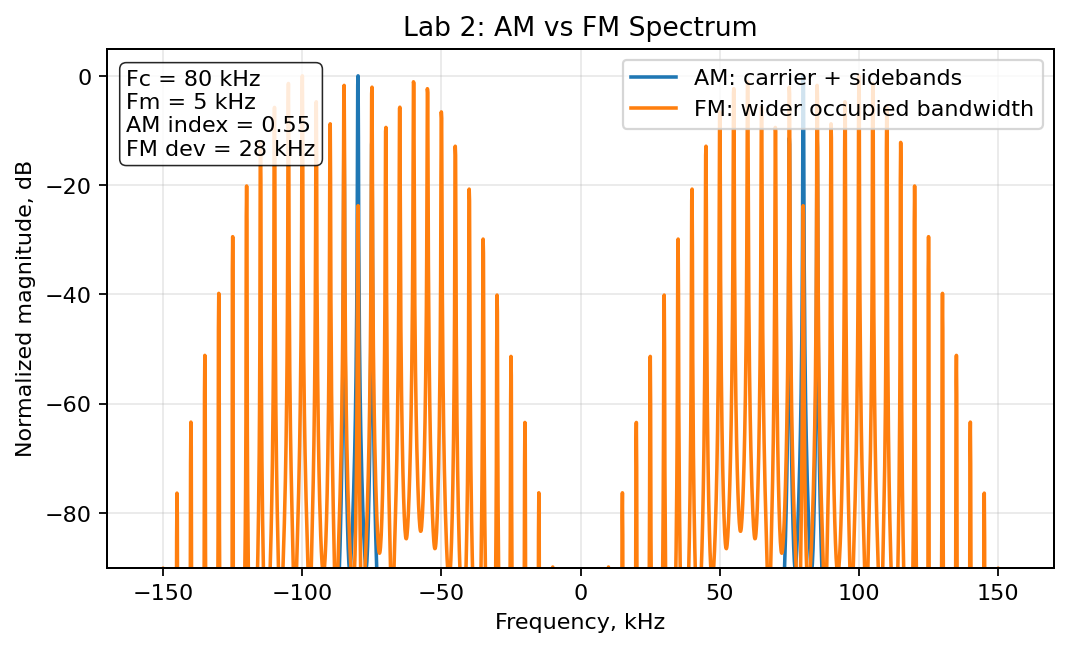
Interpretation: AM produces a carrier with sidebands, while FM spreads energy over a wider bandwidth depending on frequency deviation.
Lab 3 — QPSK Constellation
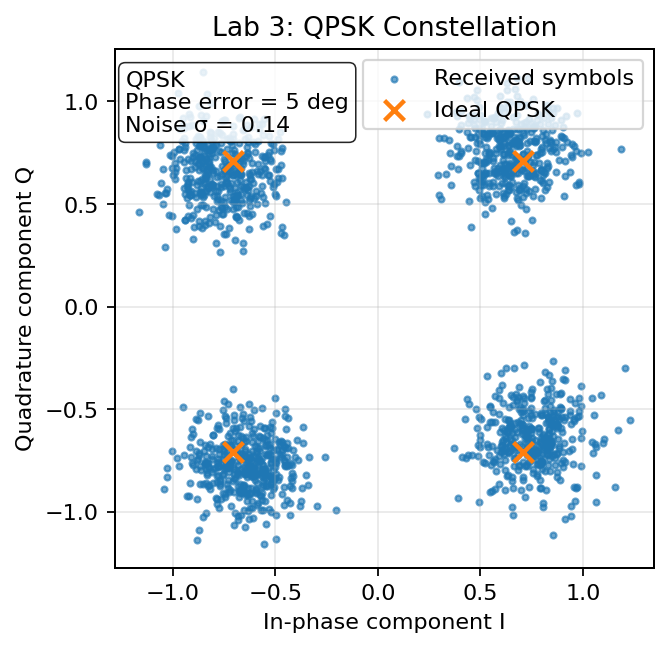
Interpretation: constellation points reveal noise and phase error. The ideal reference markers help compare the received cloud against the expected QPSK positions.
Lab 4 — Synchronization Impact
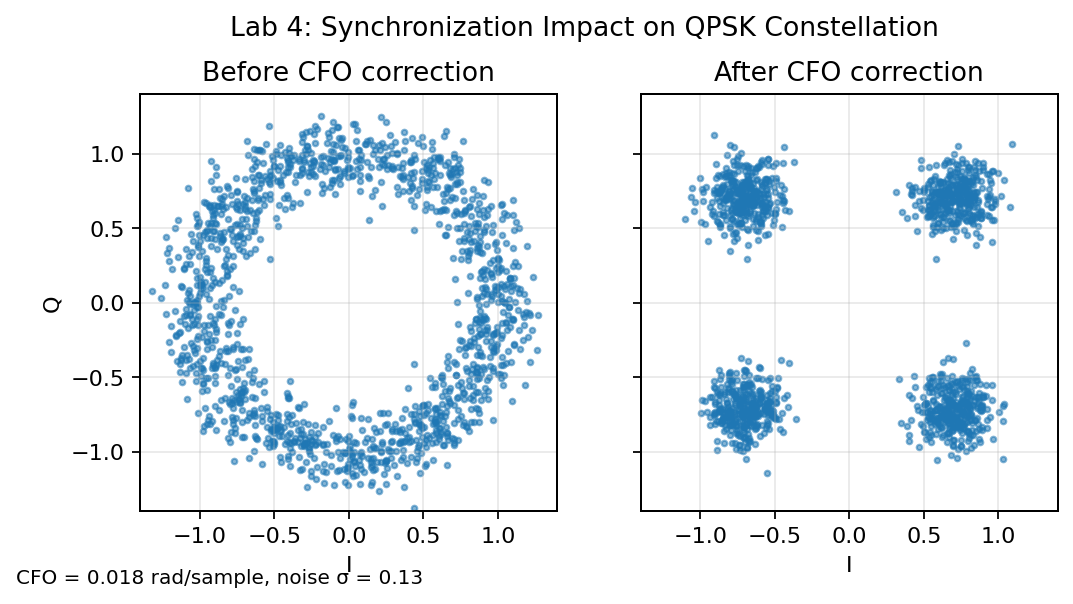
Interpretation: CFO correction stabilizes the constellation. Before correction, the cloud rotates; after correction, symbol clusters become much clearer.
Lab 5 — EVM vs Impairments
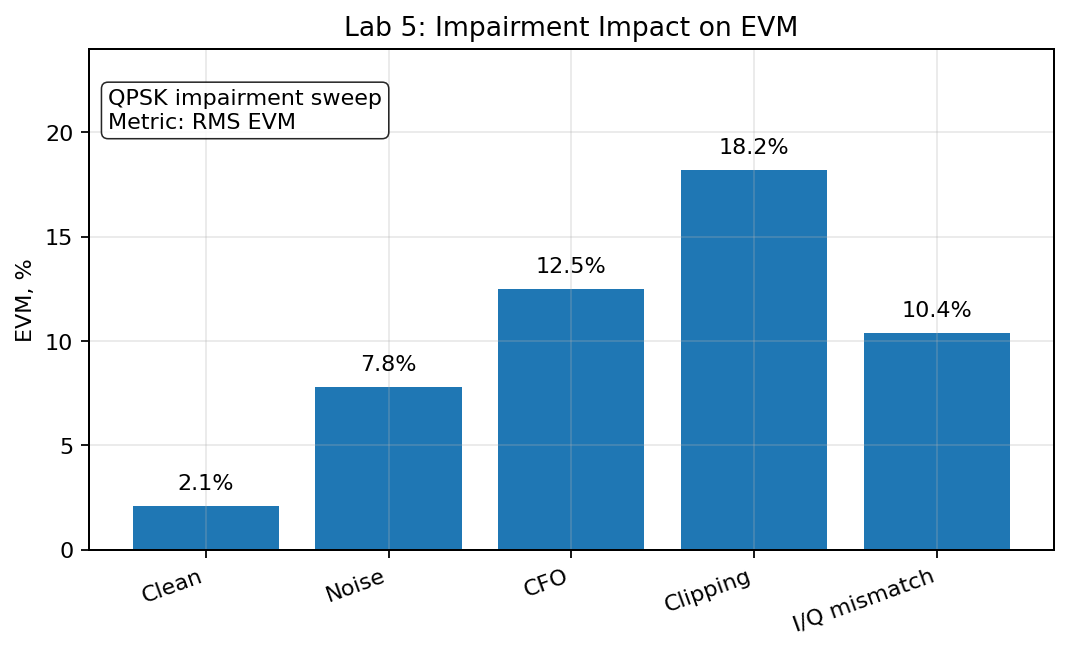
Interpretation: EVM allows different impairments to be compared on a single quantitative scale.
Lab 6 — BER Performance
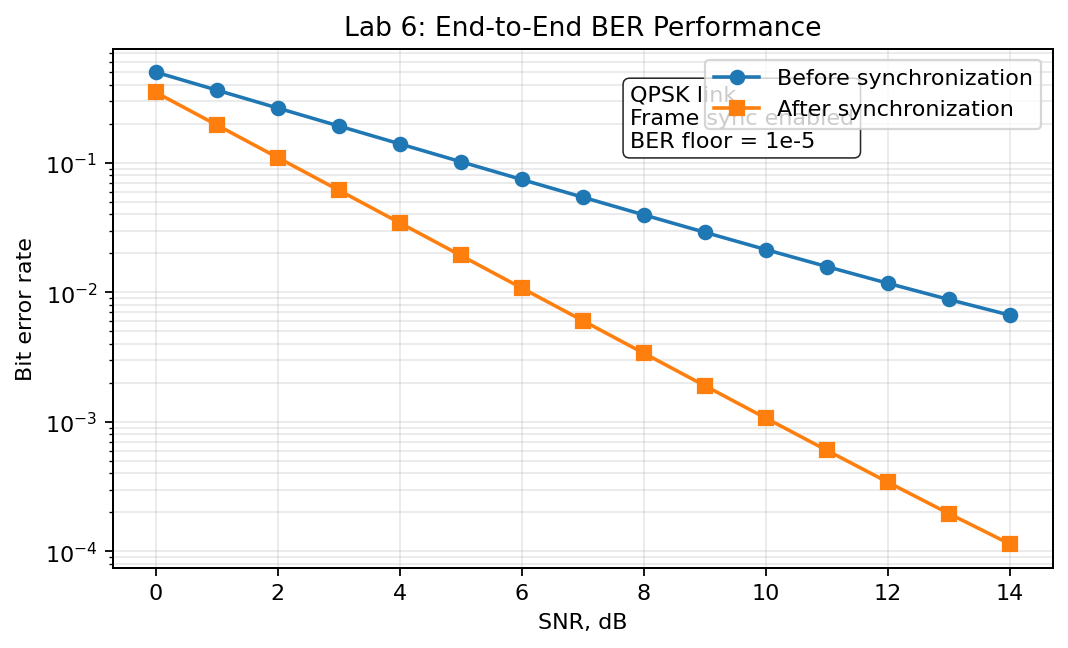
Interpretation: BER curves show how synchronization and DSP corrections affect the final quality of the receiver.
Reproduce locally
bash tools/reproduce_all.sh
Why this project matters
This repository is designed as an engineering learning system, not only a collection of notes. It connects:
- theory with practical RF observation;
- Simulink models with FPGA-oriented thinking;
- spectra and constellations with measurable metrics;
- GitHub documentation with reproducible CI-generated artifacts.
That combination makes the project useful as a course, a portfolio artifact, and a foundation for future research-oriented SDR work.