Lab 8.15 — Real-hardware BPSK: spectrum, constellation and SNR/EVM
Goal
Tie the synthetic modulation/synchronization theory of this block to real measured signals from the course hardware (Zynq-7020 + AD9361). We look at the same three quantities you compute on paper (the power spectrum, the signal constellation, and the SNR / EVM) but taken from the running board, and we compare two vantage points on the same transmitter:
- Board PL RX: what the on-chip FPGA receiver actually samples, in the AD9361
digital loopback (the exact
capture_insamples read back from the in-fabric debug tap of the Block 11 PL BPSK modem). - RTL-SDR: what an independent receiver over the air sees of the board's BPSK transmission (demodulated by the Lab 11.20 reader, which searches carrier offset, resamples and matched-filters).
This is an educational comparison: it makes the abstract "eye/constellation gets noisier and rotates over a real channel" concrete, with numbers.
What the board sees: AD9361 digital loopback
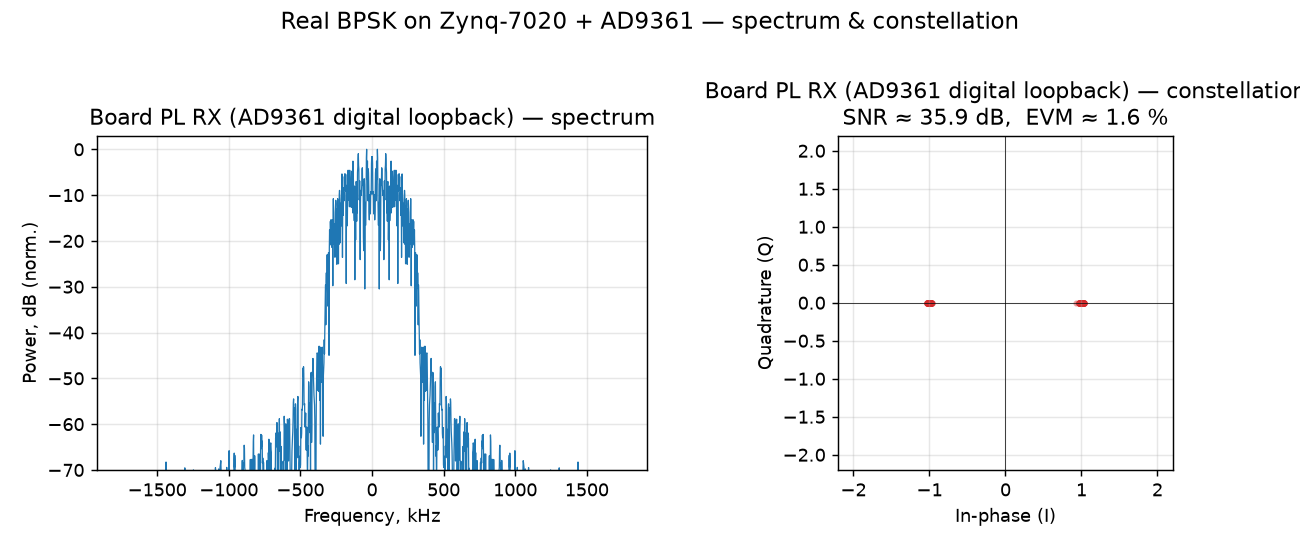
- Spectrum (left). The classic root-raised-cosine (RRC) BPSK shape: a flat-topped main lobe about ±300 kHz wide (symbol rate 480 kSym/s at SPS = 8, sample rate 3.84 MHz) with the pulse-shaping roll-off on the shoulders and low out-of-band energy.
- Constellation (right). Two tight clusters at I = ±1, Q ≈ 0. Exactly BPSK: one bit per symbol on the in-phase axis. Q is zero because the digital loopback carries no carrier, so there is no phase rotation.
- Measured quality: SNR ≈ 36 dB, EVM ≈ 1.6 %. This is the receiver's "ideal" internal view (no RF channel, no oscillator offset) and it is the reference the OTA case is measured against. (BER = 0.)
What an independent RTL-SDR sees: over the air
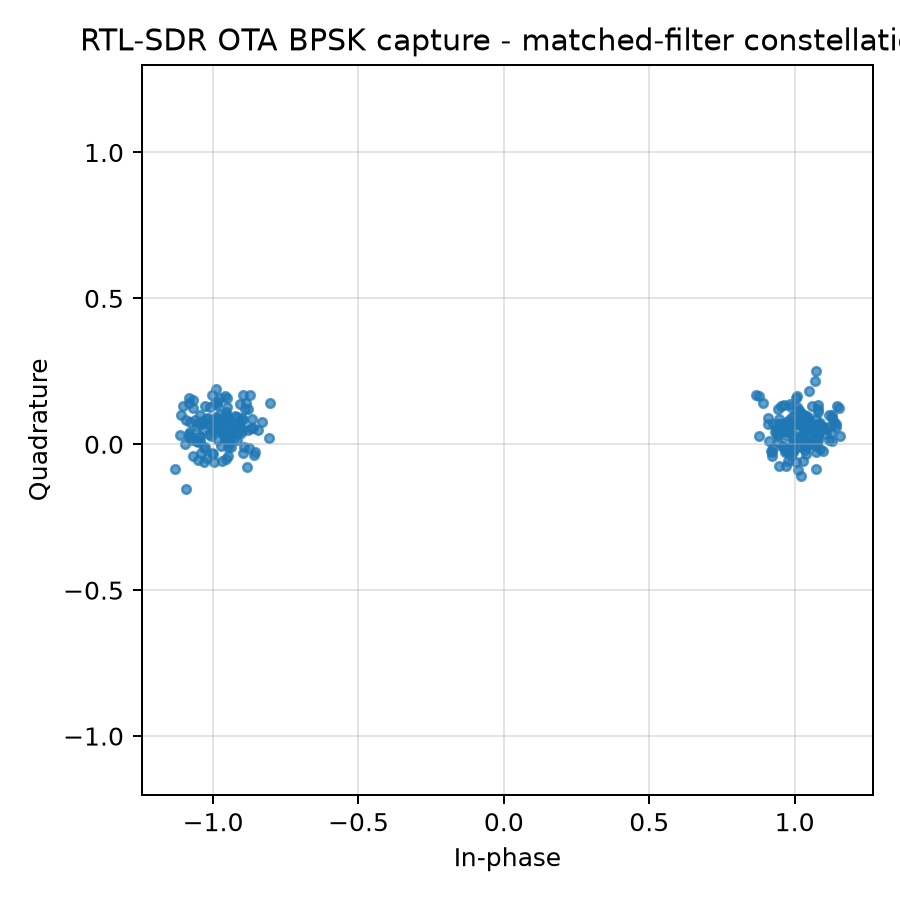
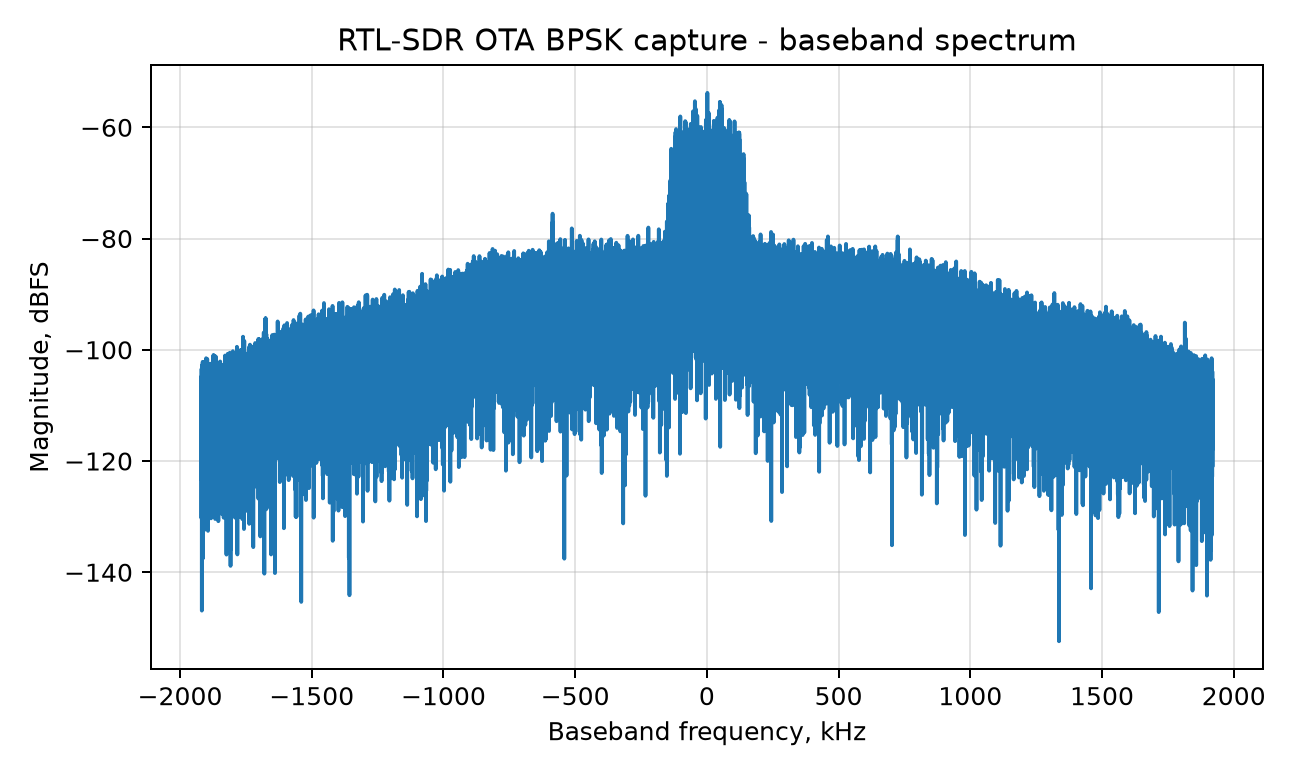
The same kind of BPSK, transmitted by the board and captured over the air by an RTL-SDR at ~10 cm, then demodulated offline. The RRC spectrum is still clearly there, but the constellation tells the channel story:
- The two clusters are noticeably wider (thermal noise + multipath): EVM ≈ 10.6 %,
i.e. SNR ≈ 19.5 dB (
SNR ≈ −20·log₁₀(EVM)), ~16 dB worse than the internal loopback. - The clusters sit slightly off the I axis (small +Q): a residual carrier phase from the +2.7 kHz frequency offset between the AD9361 TX LO and the RTL-SDR tuner, which the reader estimates and removes before slicing (this is exactly the CFO of Lab 8.1 and the phase of Lab 8.2, seen on real hardware).
- Despite all that, at 10 cm the link still decodes at BER = 0: a real, if short-range, radio link. The 10.6 % EVM and the BER come from the reader's reference-aided scoring (gain/phase fitted over the known frame). Its receiver scoring (preamble + phase-tracking loop, payload only) gives the same verdict: 0 / 256 payload bit errors, EVM 9.97 % (see Lab 11.20).
Side-by-side
| Metric | Board PL RX (AD9361 digital loopback) | RTL-SDR (over the air, ~10 cm) |
|---|---|---|
| Constellation | 2 tight points on I, Q ≈ 0 | 2 wider clusters, small +Q |
| EVM | ≈ 1.6 % | ≈ 10.6 % |
| SNR (from EVM) | ≈ 36 dB | ≈ 19.5 dB |
| Carrier frequency offset | 0 (digital, no carrier) | ≈ +2.7 kHz |
| BER | 0 | 0 |
Reading: the internal loopback isolates the modem (clean, no channel), while the RTL-SDR shows the radio link. The constellation spreads with noise and rotates with the carrier offset, but stays open enough to decode. The gap between the two constellations is, visually, the RF channel.
Why this lab matters
Everything earlier in the block was computed on synthetic data. The one thing a simulation cannot show is how little of the ideal picture survives contact with hardware: a real oscillator is never exactly on frequency, a real channel adds noise and multipath, and a real receiver has its own quantization and gain. This lab shows the same three quantities you have been computing (spectrum, constellation, SNR/EVM) measured, so you know what "good" looks like on a real board and what the gap to the ideal is made of.
How the numbers are computed
- EVM (error-vector magnitude): after the matched filter, sample one symbol per SPS at
the eye centre; the ideal BPSK point is
±Aon I.EVM_rms = rms(symbol − ideal) / A. - SNR from EVM:
SNR_dB ≈ −20·log₁₀(EVM_rms). - Spectrum: windowed FFT magnitude of the baseband samples, normalized to the peak.
Reproduce
- Board figure (from the committed 4.8 kB capture of the real PL RX samples):
python blocks/block_08_modulation_and_synchronization/python/hardware_bpsk_spectrum_constellation.py \
    --board datasets/lab11_hardware_bpsk_capture/board_pl_rx_loopback_capture.npz
- RTL-SDR OTA figures + metrics (from the recorded WAV, see the manifest):
python blocks/block_11_integrated_sdr_project/python/lab_11_20_read_rtl_wav_ota_bpsk_ber.py \
    --manifest datasets/lab11_20_rtl_sdr_ota_bpsk/manifest_live_20260624_stock_10cm_ref.yaml
Exercises
- From the two constellations, estimate the ratio of the cluster spreads by eye, then check it against the EVM values (1.6 % vs 10.6 %). How many dB apart are they, and does that match the SNR difference in the table (~16.5 dB)?
- The OTA capture shows a small +Q component in both clusters. Convert the +2.7 kHz frequency offset into a phase rotation per symbol at the OTA frame's 240 kSym/s (16 samples per symbol at 3.84 MS/s). Why does the reader still slice correctly?
- BER = 0 in both columns. How many bits were compared in each case (the board frame is 281 symbols; for the OTA case read the Lab 11.20 report output)? What is the 95 % upper bound on BER if zero errors were seen in that many bits? Why is "BER = 0" on its own weaker than it looks (compare Lab 8.7)?
Answers (checked by running the lab script)
10.6 / 1.6 ≈ 6.6in amplitude,20·log10(6.6) ≈ 16.4 dB, which matches the ~16.5 dB SNR difference: here the SNR is estimated from the EVM, so the two must agree. The OTA cluster is about six to seven times wider.2.7 kHz / 240 kSym/s = 0.011cycle per symbol, about 4.1° per symbol, or about 1140° over a 281-symbol frame: uncorrected, the constellation would spin three times. The reader estimates the frequency offset (a coarse search plus a fine search) and removes it before slicing; the small +Q component is what is left of that estimate. A residual of a few degrees is far from the 90-degree margin of BPSK.- 281 bits each (the board frame is 281 BPSK symbols, and the Lab 11.20 report recovers 281 payload bits). Zero errors in 281 bits bounds the BER below about
3/281 ≈ 1.1·10⁻²at 95 % confidence. That is a weak statement: it shows the link works, not that its error rate is low, and Lab 8.7 shows links with BER = 0 and almost no margin. A real claim needs many frames and an error count.
Report checklist
- Both figures reproduced from the commands above.
- Spectrum width, EVM, SNR and CFO quoted for each vantage point.
- A short paragraph on what the gap between the two constellations is made of.
- The number of compared bits stated next to each BER.
Notes
- The board capture is the PL BPSK modem in loopback; the OTA capture is the stock-shell BPSK reference (Lab 11.14) over the air: both are real board-transmitted BPSK, chosen because the RF-safe PL transmit power is intentionally very low, so a clean OTA constellation is easiest at close range. See Lab 11.26 for the full Block 11 hardware story (on-chip PL BPSK BER = 0).
- Follow-up (not yet done in this lab): repeat the same three plots for QPSK (four constellation points, two bits per symbol). The synthetic and HDL-loopback QPSK story is in Lab 8.8.