Lab 8.7 — SNR is not enough: BER/EVM traps
Objective
Show why a digital SDR link must not be accepted from SNR alone. A receiver can show a strong signal and a comfortable noise margin while the recovered bit stream is still wrong because of carrier offset, timing error, phase ambiguity, clipping or frame misalignment.
The lab produces a deterministic synthetic QPSK impairment sweep and records the minimum link-quality evidence expected from later RF labs: SNR, EVM, BER, compared bit count, frame-sync assumption and engineering conclusion.
Why this lab matters
On the bench the first number everyone reads is SNR: the spectrum analyzer or the waterfall shows a strong peak well above the noise floor, and the natural conclusion is "the link works". This lab is the antidote. SNR is a property of the analog signal: how much power sits in the wanted signal compared to the noise. A digital link additionally needs the receiver to make the right decision at the right instant, in the right rotation, on the right frame. Each of those is a separate thing that can fail while SNR stays perfectly healthy.
Every later RF lab in this course ends with a BER (or FER) and a compared-bit count for exactly this reason. This lab shows, with six controlled experiments, what that rule protects you from.
Key lesson
SNR answers: "Is the signal visible above the noise?"
BER answers: "Did the digital link recover the correct bits?"
For BPSK/QPSK/OFDM labs, a high SNR is only a necessary condition. It is not a proof of a working digital link. A reviewed result should include BER or FER and the number of bits or frames that were actually compared.
Files
| Path | Purpose |
|---|---|
blocks/block_08_modulation_and_synchronization/python/lab_8_7_snr_vs_ber_traps.py |
deterministic QPSK impairment sweep with SNR/EVM/BER metrics |
Run
python blocks/block_08_modulation_and_synchronization/python/lab_8_7_snr_vs_ber_traps.py
The run is deterministic (fixed seed 8701, 4096 QPSK symbols, 8 samples per
symbol, RRC roll-off 0.35), so your numbers should match the table below.
Scenarios
| Scenario | What remains high | What fails | Lesson |
|---|---|---|---|
| AWGN reference | SNR | nothing significant | Baseline case where SNR tracks BER reasonably well. |
| High-SNR CFO | SNR | BER/EVM | Frequency offset rotates the constellation; SNR does not see the phase walk. |
| Timing error | SNR | BER/EVM | Sampling away from the symbol center creates wrong decisions. |
| QPSK 90-degree ambiguity | SNR and aligned EVM | BER | A constellation can look clean after rotation, but bits are mapped to the wrong quadrant. |
| Clipping / overload | apparent SNR | EVM/BER margin | ADC/numeric overload is not Gaussian noise. |
| Wrong frame alignment | SNR | BER | A strong packet is useless if the receiver compares the wrong bits. |
What to expect
With the default configuration the run prints (and stores in
lab87_snr_vs_ber_metrics.json):
| Scenario | SNR | EVM | BER (errors / compared bits) |
|---|---|---|---|
awgn_reference |
18 dB | 4.7 % | 0 (0 / 8192) |
high_snr_cfo |
25 dB | ≫ 100 % | 0.501 (4105 / 8192) |
timing_error |
25 dB | 66.8 % | 0.053 (437 / 8192) |
qpsk_90deg_ambiguity |
25 dB | 2.6 % | 0.500 (4096 / 8192) |
clipping_overload |
25 dB | 8.1 % | 0 (0 / 8192) |
wrong_frame_alignment |
25 dB | ≫ 100 % | 0.512 (4194 / 8190) |
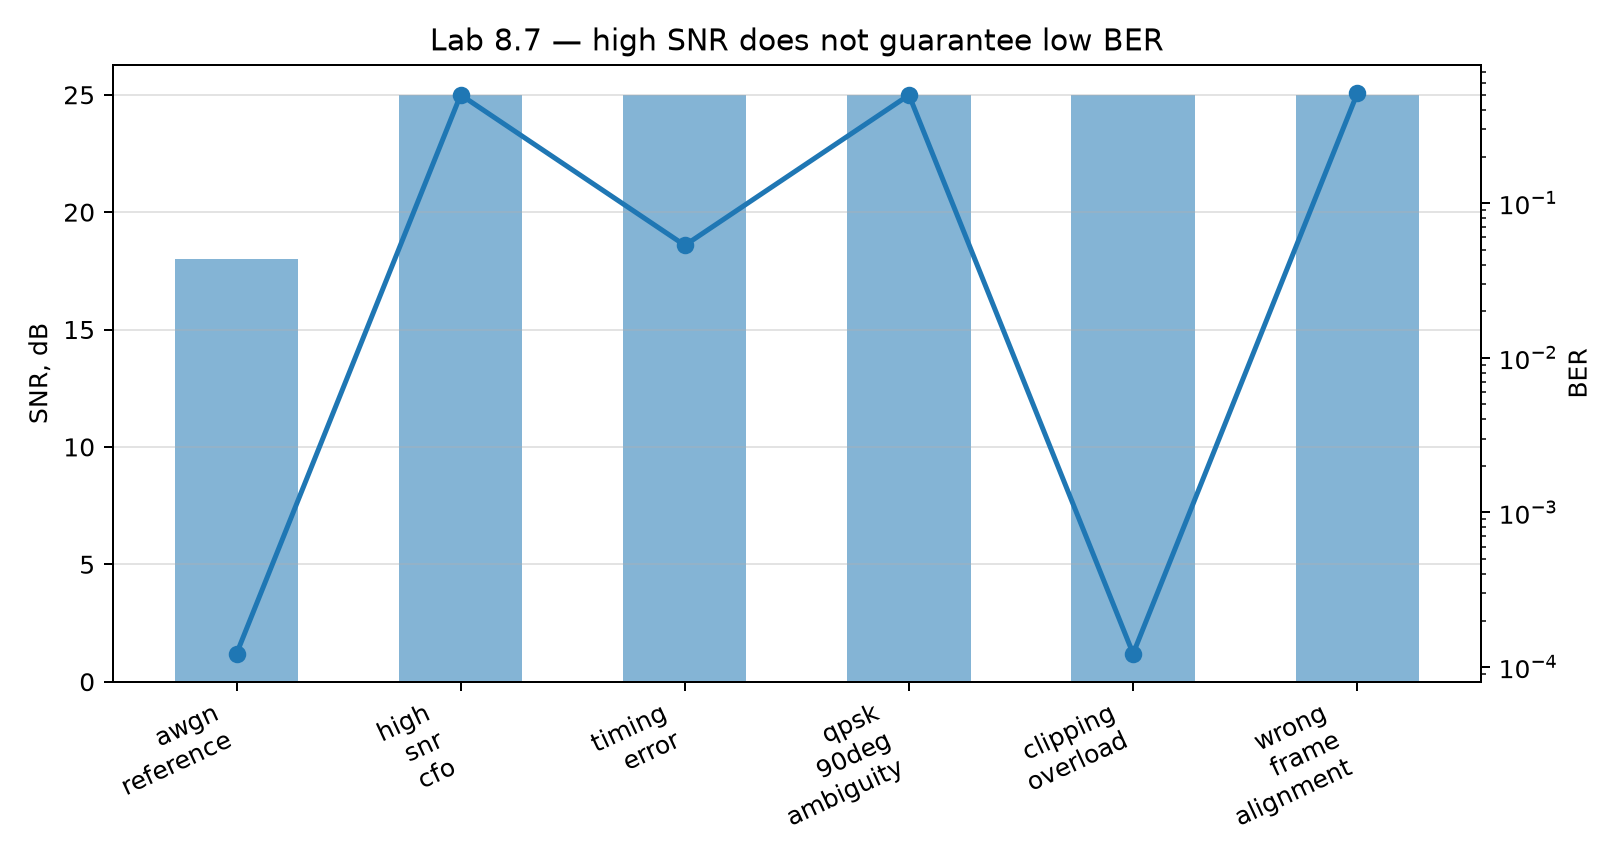
Note that the AWGN reference deliberately has the lowest SNR (18 dB) and the best BER. Every impaired case has 7 dB more SNR and is still worse on BER or EVM: most of them catastrophically. Read the rows one at a time:
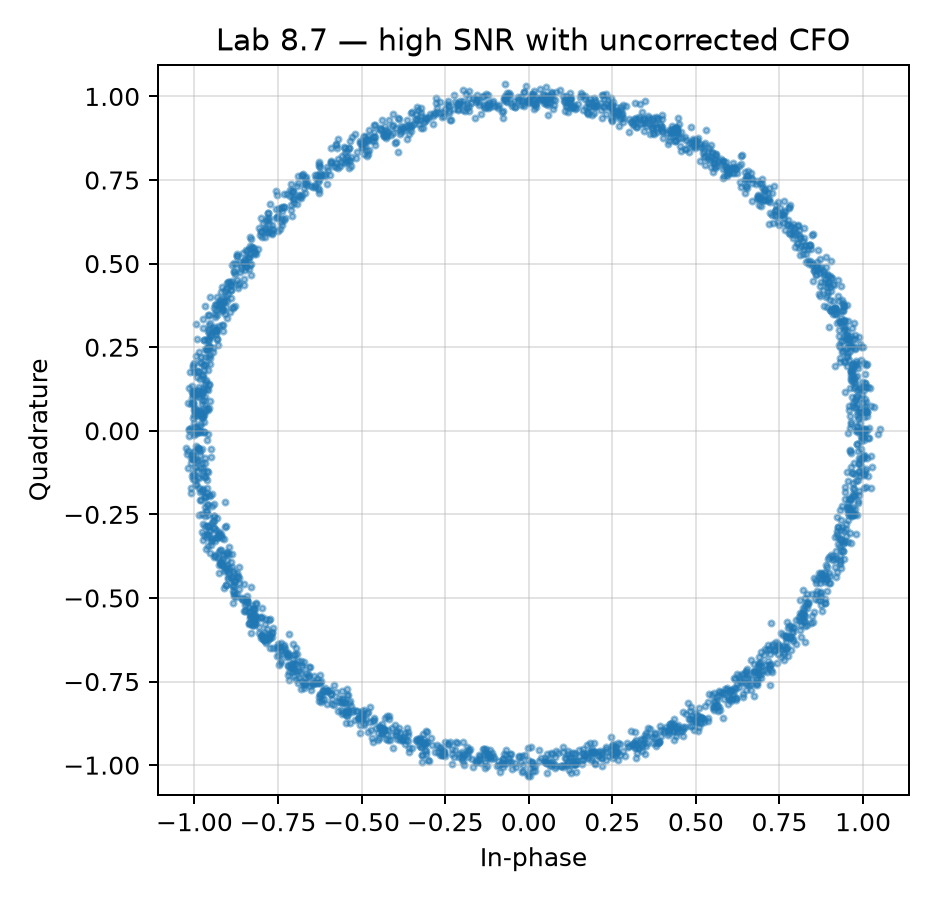
- High-SNR CFO: BER 0.5, the "coin flip". A carrier offset of 25 kHz at
480 kSym/s is
25e3 / 480e3 ≈ 0.052cycle per symbol, i.e. the constellation rotates by about 19° every symbol and smears into the ring below. After a handful of symbols the phase has visited every quadrant, so each decision is essentially random: BER ≈ 0.5, which is the same as guessing. SNR is unchanged by rotation (the ring is thin) which is why SNR cannot see the problem. The EVM is meaningless (tens of thousands of percent) and is a hint by itself: when EVM is above 100 %, the receiver is not looking at the transmitted constellation at all.
- Timing error: BER 0.053. The receiver samples 3 samples (of 8 per symbol) away from the matched-filter peak, i.e. 0.375 symbol. The eye is partly closed by inter-symbol interference, the constellation clusters smear towards each other, and about one bit in twenty is wrong even though noise is negligible. The remedy is a timing-recovery loop, see Lab 8.3.
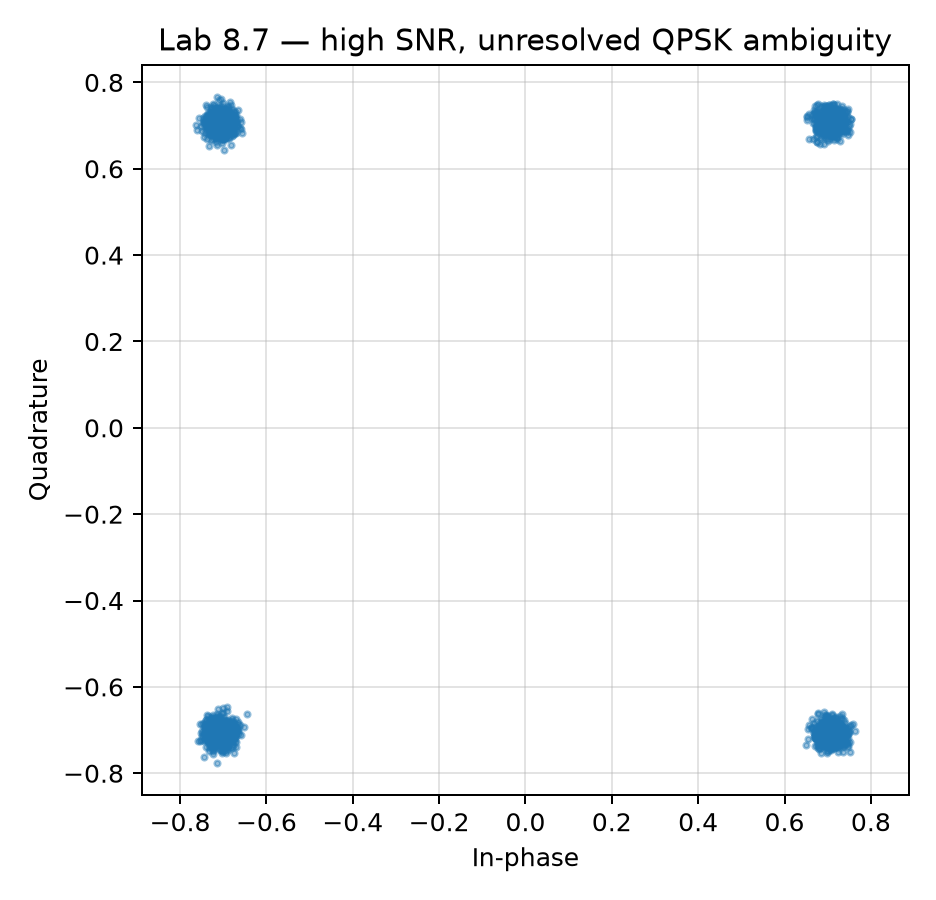
- QPSK 90° ambiguity: the sneakiest case. The constellation has four crisp,
tight clusters and the EVM after the receiver's best-fit alignment is 2.6 %,
better than the reference. Yet BER is exactly 0.5. A carrier-recovery loop
cannot distinguish "this quadrant is
00" from "this quadrant is00rotated by 90°", because the constellation is symmetric under rotation by 90°. The bits are mapped to the wrong quadrant every time. It is resolved by a known preamble or by differential coding (see Lab 8.9).
- Clipping: a lesson in the other direction. With a clip limit of 0.18 the waveform is squashed and EVM rises from 2.5 % (unclipped, same SNR) to 8 %, but BER is still zero. QPSK only uses the sign of I and Q for its decisions, and clipping preserves signs: it distorts amplitudes, not quadrants. So for QPSK the damage shows up in EVM long before it shows up in BER: BER = 0 does not mean the link has margin. The same clipping would be far more damaging for 16-QAM or OFDM, where amplitude carries information (see Lab 8.10). Overload is a nonlinear impairment, not Gaussian noise; see the gain sweep in Block 6.
- Wrong frame alignment: BER 0.512, with 8190 bits, not 8192. The receiver is one symbol out of step with the transmitter, so it compares the wrong bits to each other (and loses two at the end of the record: the compared-bit count already hints that something is off). This is the pure "framing" failure: perfect signal, useless packet. Real systems detect it with a preamble/sync word and a CRC.
Expected outputs
| File | Content |
|---|---|
docs/assets/lab87_snr_vs_ber_summary.png |
SNR versus BER summary plot |
docs/assets/lab87_constellation_cfo.png |
constellation example with carrier-frequency offset |
docs/assets/lab87_constellation_timing_error.png |
constellation example with timing error |
docs/assets/lab87_constellation_qpsk_phase_ambiguity.png |
constellation example with unresolved QPSK quadrant ambiguity |
docs/assets/lab87_snr_vs_ber_metrics.json |
machine-readable scenario metrics and conclusions |
Acceptance rule for later digital-link labs
A BPSK/QPSK/OFDM result is not considered a confirmed digital link until the report states:
- SNR or noise estimate;
- EVM or constellation-quality metric;
- BER or FER;
- number of compared bits or frames;
- frame-sync status;
- frequency/timing offset notes when relevant.
If BER/FER is missing, the conclusion should be limited to spectrum or waveform quality, not digital-link correctness.
Exercises
- In the script, change the CFO scenario to
cfo_hz=50.0, then 100 and 200. Compute the rotation per symbol (cfo / symbol_rate * 360°) and the phase accumulated over the 4096-symbol record. Even 50 Hz gives BER ≈ 0.42 here: why is such a tiny offset already fatal for a receiver with no phase tracking? - Sweep
timing_offset_samplesfrom 0 to 4 at 25 dB SNR. Find the largest offset that still gives BER = 0, and note the EVM at that offset. What does that say about EVM versus BER as an acceptance test? (Expect BER = 0 up to 2 samples with an EVM already near 38 %.) - Sweep the clip limit from 0.5 down to 0.05. EVM rises and saturates but BER never leaves zero. Explain why, using what QPSK decisions actually look at, and predict what would happen to a 16-QAM link (Lab 8.11).
- In the ambiguity scenario, try phase 45°, 90° and 180°. BER should be about 0.25, 0.5 and 1.0 while the aligned EVM stays at ≈2.5 % for all three. Why can BER be exactly 1.0 (a perfect inverted link) and why does the EVM stay blind to it?
- Write the engineering conclusion (template below) for the timing-error row.
Answers (checked by running the lab script)
- At 480 kSym/s: 50 Hz is 0.0375° per symbol and 154° over 4096 symbols; 100 Hz is 0.075° and 307°; 200 Hz is 0.15° and 614°. Without phase tracking the decisions are right only while the rotation stays inside ±45°. At 50 Hz that holds for the first 1200 symbols; from 45° to 135° one bit of each symbol is wrong and beyond 135° both are, which gives
(2400·1 + 496·2)/8192 ≈ 0.41, the observed 0.42. A frequency error integrates into a phase error, so any offset is fatal over a long enough record. - The numbers are in the exercise: BER stays 0 up to 2 samples while the EVM is already about 38 %. EVM measures how far the points moved; BER measures whether they crossed a boundary. A link that passes BER = 0 at 38 % EVM has almost no margin left, so an acceptance test needs both.
- QPSK decides on the signs of I and Q only, and clipping a symmetric signal preserves signs, so BER cannot leave zero however hard you clip. 16-QAM also decides inner versus outer amplitude on each axis; clipping pulls the outer points towards the inner ones and those decisions fail long before any sign does.
- A rotation of 180° inverts both bits of every symbol, so every bit is wrong: BER 1.0, a perfect link with the wrong reference. 45° puts every point on a boundary (BER ≈ 0.25), 90° inverts one bit per symbol (0.5). The aligned EVM is computed after the analysis rotates the received points onto the reference, so it removes exactly the error you are looking for; that alignment is a measurement convenience, not something the receiver can do.
- Example: "At 25 dB SNR, sampling 3 of 8 samples (0.375 symbol) away from the matched-filter peak gives BER 0.053 (437/8192 bits) and EVM 66.8 %. The noise is negligible; the errors come from inter-symbol interference. BER returns to 0 for offsets up to 2 samples, but with EVM near 38 %, so the link needs a timing-recovery loop (Lab 8.3), not more SNR."
Engineering conclusion template
The signal had SNR = ____ dB and EVM = ____ %, but BER = ____ over ____ bits.
Therefore the experiment confirms / does not confirm a working digital link.
The limiting factor is most likely ____ because ____.
Report checklist
- Metrics JSON and the summary plot attached.
- All six scenarios listed with SNR, EVM, BER and compared-bit count.
- One paragraph per failing scenario: what fails, why SNR did not show it.
- The acceptance rule quoted and applied to one of your own earlier labs.